
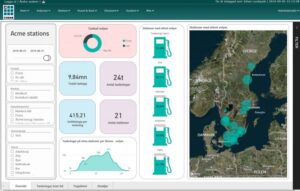
Analyze your station and network data quickly and easily using graphical raports. Graphical reports that simplify the decision-making process are now available from within TapNet. Our new graphical reports engine will visualize your data in TapNet reports customized for filling stations.
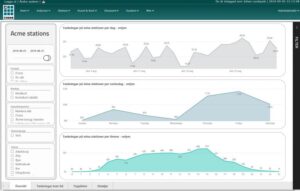
Follow operations and sales in real-time or compare different time intervals. Drill down from high level KPI:s that provide the bigger picture to detailed data for analysis of individual stations, fuels or sales variations over time. You will easily get an overview of where your customers fill their cars, which fuels that are most popular in different areas and how the buying patterns change over time.
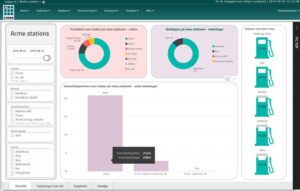
When you opt for graphical reports in TapNet you get access to all the standard reports. For a majority of station owners these covers everything necessary to take analysis and reporting to the next level. The graphical reports with visualized data is particulary well suited for reporting on management level, to owners or at company board meetings.
If you require additional or tailored reports, our TapNet developers will assist you in creating new reporting templates.
To book a demo or to learn more about the possibilities with the new TapNet graphical reports, contact Johan Lundquist at +46 (0) 819 81 01 or jl@codab.se.